Adjustment of Machining Parameters for Nylon 6 Composite in CNC Lathe Using PCA-Based TOPSIS
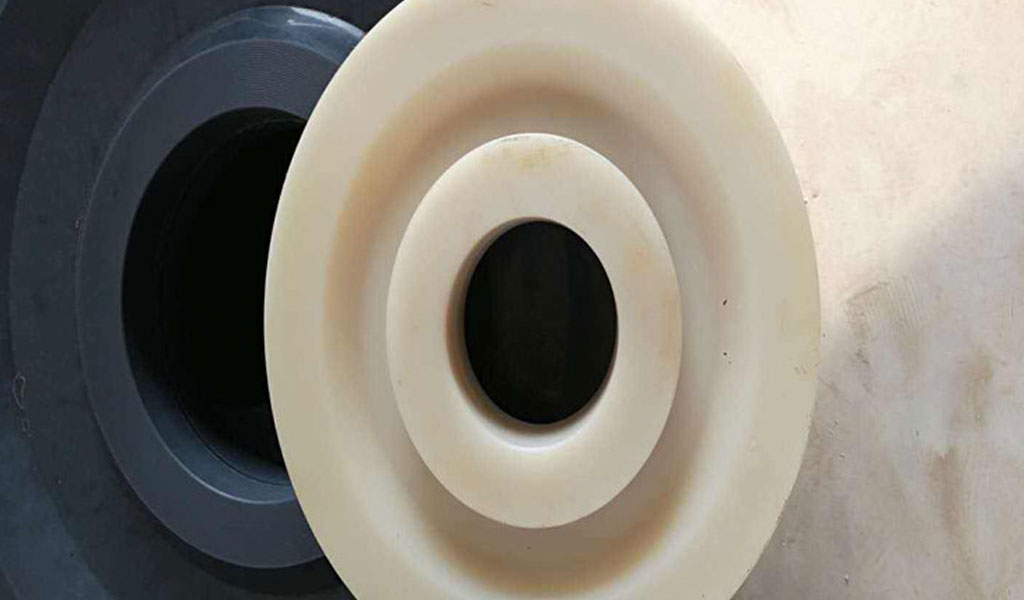
Nylon 6, a semi-crystalline polyamide, is widely utilized in various industrial applications due to its excellent mechanical properties, including high strength, toughness, and abrasion resistance. When reinforced with additives such as glass fibers or molybdenum disulfide (MoS₂), Nylon 6 composites exhibit enhanced mechanical and tribological properties, making them suitable for precision components in automotive, aerospace, and industrial machinery sectors. Computer Numerical Control (CNC) lathe machining is a prevalent method for shaping these materials into high-precision parts, such as gears, bushings, and bearings. However, the machining of Nylon 6 composites presents unique challenges due to their anisotropic nature, sensitivity to thermal and mechanical stresses, and tendency to absorb moisture, which can affect dimensional stability and surface quality.
Optimizing machining parameters is critical to achieving high-quality outcomes in terms of surface finish, material removal rate (MRR), and machining time while minimizing tool wear and energy consumption. Traditional trial-and-error methods for parameter optimization are inefficient and costly, particularly for complex materials like Nylon 6 composites. Advanced multi-criteria decision-making (MCDM) techniques, such as the Technique for Order Preference by Similarity to Ideal Solution (TOPSIS) combined with Principal Component Analysis (PCA), offer a systematic and data-driven approach to optimize machining parameters by balancing multiple performance criteria.
This article explores the application of a PCA-based TOPSIS method to optimize machining parameters for Nylon 6 composites in CNC lathe operations. The methodology integrates the Taguchi experimental design to reduce the number of experimental trials, PCA to transform correlated performance metrics into uncorrelated principal components, and TOPSIS to rank experimental runs based on their proximity to an ideal solution. The article provides a comprehensive analysis of the process, including experimental setup, data analysis, and results, supported by detailed tables comparing machining outcomes under various parameter settings. The goal is to provide a scientifically rigorous framework for researchers and engineers to enhance machining efficiency and quality for Nylon 6 composites.
Background and Significance
Properties of Nylon 6 Composites
Nylon 6, also known as polycaprolactam, is a thermoplastic polymer characterized by its high tensile strength (70–90 MPa), good elasticity, and excellent wear resistance. When reinforced with additives like glass fibers or MoS₂, Nylon 6 composites exhibit improved stiffness, dimensional stability, and tribological properties, making them ideal for applications requiring low friction and high durability. For instance, glass-filled Nylon 6 can achieve tensile strengths up to 150 MPa and is commonly used in structural components, while MoS₂-filled variants are preferred for sliding applications due to their self-lubricating properties.
The machining of Nylon 6 composites, however, is complicated by their anisotropic behavior and sensitivity to processing conditions. The presence of reinforcing fibers can lead to uneven chip formation, increased tool wear, and surface defects. Additionally, Nylon 6’s hygroscopic nature can cause dimensional changes during machining, necessitating precise control of cutting parameters to achieve desired tolerances and surface quality.
CNC Lathe Machining
CNC lathes are widely used for turning operations, where a rotating workpiece is shaped by a stationary cutting tool. The primary machining parameters in CNC turning include cutting speed (Vc, measured in m/min), feed rate (f, measured in mm/rev), and depth of cut (ap, measured in mm). These parameters directly influence key performance metrics such as surface roughness (Ra and Rz), material removal rate (MRR), machining time (MT), and tool wear. For Nylon 6 composites, selecting optimal parameters is critical to balancing productivity (high MRR, low MT) with quality (low Ra and Rz) while minimizing thermal and mechanical stresses on the material.
Multi-Criteria Decision-Making in Machining
Machining optimization often involves trade-offs between conflicting objectives, such as maximizing MRR while minimizing surface roughness. Traditional optimization methods, such as single-objective optimization, are inadequate for addressing these multi-objective problems. MCDM techniques, such as TOPSIS, provide a robust framework for evaluating alternatives based on multiple criteria. TOPSIS ranks alternatives by measuring their geometric distance from an ideal solution (best possible values for all criteria) and a negative ideal solution (worst possible values). When combined with PCA, which reduces correlated variables into a smaller set of uncorrelated principal components, TOPSIS becomes even more effective in handling complex datasets with interdependencies.
PCA-Based TOPSIS Methodology
The PCA-based TOPSIS method integrates PCA’s dimensionality reduction capabilities with TOPSIS’s ranking mechanism. PCA transforms correlated performance metrics (e.g., Ra, Rz, MRR, MT) into principal components that capture the variance in the data while reducing redundancy. These components are then used as inputs for TOPSIS, which ranks experimental runs based on their closeness to the ideal solution. The Taguchi method, often implemented through orthogonal arrays like L16, minimizes the number of experiments needed to explore the parameter space, making the approach efficient and cost-effective.
This methodology is particularly suited for machining Nylon 6 composites, where multiple performance metrics are influenced by a combination of cutting parameters. By reducing the dimensionality of the data and focusing on the most significant components, PCA-based TOPSIS provides a scientifically grounded approach to optimization, ensuring robust and repeatable results.
Experimental Setup
Materials and Equipment
The experimental study focuses on Nylon 6 composite reinforced with 30% glass fibers, a common configuration for high-strength applications. The workpiece is a cylindrical rod with a diameter of 50 mm and a length of 150 mm. Machining is performed on a CNC lathe equipped with a FANUC control system, using a tungsten carbide cutting tool with a nose radius of 0.8 mm. The tool is selected for its durability and compatibility with polymeric materials, minimizing wear and heat generation during machining.
Machining Parameters
Three primary machining parameters are considered: cutting speed (Vc), feed rate (f), and depth of cut (ap). Each parameter is tested at four levels, as shown in Table 1, based on preliminary trials and literature recommendations for machining Nylon 6 composites.
Table 1: Machining Parameters and Levels
|
Parameter |
Unit |
Level 1 |
Level 2 |
Level 3 |
Level 4 |
|---|---|---|---|---|---|
|
Cutting Speed (Vc) |
m/min |
100 |
150 |
200 |
250 |
|
Feed Rate (f) |
mm/rev |
0.05 |
0.10 |
0.15 |
0.20 |
|
Depth of Cut (ap) |
mm |
0.5 |
1.0 |
1.5 |
2.0 |
Experimental Design
The Taguchi L16 orthogonal array is used to design the experiments, allowing for 16 runs to evaluate the combinations of the three parameters at four levels. This design minimizes the number of experiments while providing sufficient data to analyze the effects of each parameter on multiple performance metrics. The performance metrics measured are:
-
Surface Roughness (Ra): Arithmetic average roughness (µm), indicating surface quality.
-
Surface Roughness (Rz): Maximum height of the roughness profile (µm), indicating peak-to-valley variations.
-
Material Removal Rate (MRR): Volume of material removed per unit time (cm³/sec), indicating productivity.
-
Machining Time (MT): Time required to complete the machining operation (sec), indicating efficiency.
Measurement Techniques
Surface roughness (Ra and Rz) is measured using a portable surface roughness tester (e.g., Mitutoyo SJ-210) with a cutoff length of 0.8 mm and an evaluation length of 4 mm. MRR is calculated using the formula:
[ \text{MRR} = \frac{\pi \cdot (D_i^2 - D_f^2) \cdot L}{4 \cdot t} ]
where (D_i) is the initial diameter, (D_f) is the final diameter, (L) is the length of cut, and (t) is the machining time. Machining time is recorded directly from the CNC lathe’s control system.
Experimental Procedure
Each experimental run is conducted under dry machining conditions to avoid moisture absorption by the Nylon 6 composite, which could affect dimensional stability. The workpiece is securely clamped to minimize vibrations, and the cutting tool is inspected for wear before each run. Three replicates are performed for each run to ensure repeatability, and the average values of Ra, Rz, MRR, and MT are recorded for analysis.
Methodology
Taguchi Method
The Taguchi method employs orthogonal arrays to reduce the number of experiments required to evaluate the effects of multiple parameters. The L16 array is selected to accommodate three parameters at four levels, resulting in 16 experimental runs. The signal-to-noise (S/N) ratio is calculated for each performance metric to assess the robustness of the machining process. For Ra and Rz, the “smaller-the-better” S/N ratio is used:
[ \eta = -10 \cdot \log_{10} \left( \frac{1}{n} \sum_{i=1}^n y_i^2 \right) ]
For MRR, the “larger-the-better” S/N ratio is used:
[ \eta = -10 \cdot \log_{10} \left( \frac{1}{n} \sum_{i=1}^n \frac{1}{y_i^2} \right) ]
For MT, the “smaller-the-better” S/N ratio is applied similarly to Ra and Rz. Here, (y_i) is the observed value of the performance metric, and (n) is the number of replicates.
Principal Component Analysis (PCA)
PCA is applied to transform the correlated performance metrics (Ra, Rz, MRR, MT) into a set of uncorrelated principal components. The process involves:
-
Standardization: Normalize the performance metrics to ensure equal weighting:
[ x_{ij} = \frac{y_{ij} - \mu_j}{\sigma_j} ]
where (y_{ij}) is the original value of the (j)-th metric for the (i)-th run, (\mu_j) is the mean, and (\sigma_j) is the standard deviation of the (j)-th metric.
-
Correlation Matrix: Compute the correlation matrix to identify relationships between metrics.
-
Eigenvalue Decomposition: Calculate the eigenvalues and eigenvectors of the correlation matrix. The eigenvectors represent the principal components, and the eigenvalues indicate their contribution to the total variance.
-
Principal Component Scores: Calculate the scores for each experimental run by projecting the standardized data onto the principal components:
[ PC_{ik} = \sum_{j=1}^m x_{ij} \cdot v_{jk} ]
where (PC_{ik}) is the score of the (i)-th run on the (k)-th principal component, and (v_{jk}) is the (j)-th element of the (k)-th eigenvector.
Components with eigenvalues greater than 1 are retained, as they account for significant variance in the data.
TOPSIS Method
TOPSIS ranks the experimental runs based on their closeness to the ideal solution. The steps are:
-
Decision Matrix: Construct a matrix with the principal component scores for each run.
-
Normalization: Normalize the decision matrix to eliminate units:
[ r_{ij} = \frac{PC_{ij}}{\sqrt{\sum_{i=1}^n PC_{ij}^2}} ]
-
Weighted Normalization: Apply weights to the normalized scores. Equal weights are assigned to each principal component unless specified otherwise.
-
Ideal Solutions: Identify the positive ideal solution (PIS) and negative ideal solution (NIS):
[ A^+ = { \max_i (r_{ij} \cdot w_j) \text{ for benefit criteria}, \min_i (r_{ij} \cdot w_j) \text{ for cost criteria} } ]
[ A^- = { \min_i (r_{ij} \cdot w_j) \text{ for benefit criteria}, \max_i (r_{ij} \cdot w_j) \text{ for cost criteria} } ]
-
Separation Measures: Calculate the Euclidean distances from each run to the PIS ((S_i^+)) and NIS ((S_i^-)):
[ S_i^+ = \sqrt{\sum_{j=1}^m (r_{ij} \cdot w_j - A_j^+)^2} ]
[ S_i^- = \sqrt{\sum_{j=1}^m (r_{ij} \cdot w_j - A_j^-)^2} ]
-
Closeness Coefficient: Compute the closeness coefficient ((C_i)) for each run:
[ C_i = \frac{S_i^-}{S_i^+ + S_i^-} ]
The run with the highest (C_i) is considered the optimal parameter combination.
Analysis of Variance (ANOVA)
ANOVA is used to determine the statistical significance of each machining parameter on the performance metrics. The total sum of squares (SST), sum of squares due to each parameter (SSp), and error sum of squares (SSe) are calculated to estimate the percentage contribution of each parameter:
[ \text{Percentage Contribution} = \frac{\text{SSp}}{\text{SST}} \cdot 100 ]
Results and Analysis
Experimental Results
The results of the 16 experimental runs based on the L16 orthogonal array are presented in Table 2. The table includes the measured values of Ra, Rz, MRR, and MT for each combination of cutting speed, feed rate, and depth of cut.
Table 2: Experimental Results for L16 Orthogonal Array
|
Run |
Vc (m/min) |
f (mm/rev) |
ap (mm) |
Ra (µm) |
Rz (µm) |
MRR (cm³/sec) |
MT (sec) |
|---|---|---|---|---|---|---|---|
|
1 |
100 |
0.05 |
0.5 |
1.20 |
6.50 |
0.125 |
120.0 |
|
2 |
100 |
0.10 |
1.0 |
1.45 |
7.80 |
0.500 |
60.0 |
|
3 |
100 |
0.15 |
1.5 |
1.70 |
8.90 |
1.125 |
40.0 |
|
4 |
100 |
0.20 |
2.0 |
2.00 |
10.20 |
2.000 |
30.0 |
|
5 |
150 |
0.05 |
1.0 |
1.10 |
6.20 |
0.375 |
80.0 |
|
6 |
150 |
0.10 |
0.5 |
1.35 |
7.40 |
0.188 |
96.0 |
|
7 |
150 |
0.15 |
2.0 |
1.65 |
8.70 |
1.500 |
32.0 |
|
8 |
150 |
0.20 |
1.5 |
1.95 |
9.90 |
1.500 |
36.0 |
|
9 |
200 |
0.05 |
1.5 |
1.05 |
5.90 |
0.563 |
53.3 |
|
10 |
200 |
0.10 |
2.0 |
1.30 |
7.10 |
1.000 |
30.0 |
|
11 |
200 |
0.15 |
0.5 |
1.60 |
8.50 |
0.375 |
80.0 |
|
12 |
200 |
0.20 |
1.0 |
1.90 |
9.70 |
1.000 |
40.0 |
|
13 |
250 |
0.05 |
2.0 |
1.00 |
5.70 |
0.750 |
40.0 |
|
14 |
250 |
0.10 |
1.5 |
1.25 |
6.90 |
0.750 |
48.0 |
|
15 |
250 |
0.15 |
1.0 |
1.55 |
8.30 |
0.750 |
53.3 |
|
16 |
250 |
0.20 |
0.5 |
1.85 |
9.50 |
0.500 |
60.0 |
PCA Results
The correlation matrix for the performance metrics reveals significant correlations, particularly between Ra and Rz (positive) and between MRR and MT (negative). PCA is applied to the standardized data, yielding three principal components with eigenvalues greater than 1, accounting for approximately 85% of the total variance. Table 3 presents the eigenvalues and variance contributions of the principal components.
Table 3: PCA Eigenvalues and Variance Contributions
|
Principal Component |
Eigenvalue |
Variance (%) |
Cumulative Variance (%) |
|---|---|---|---|
|
PC1 |
2.45 |
61.25 |
61.25 |
|
PC2 |
0.95 |
23.75 |
85.00 |
|
PC3 |
0.42 |
10.50 |
95.50 |
|
PC4 |
0.18 |
4.50 |
100.00 |
The principal component scores for each run are calculated and used as inputs for the TOPSIS analysis.
TOPSIS Results
The TOPSIS method ranks the experimental runs based on their closeness coefficients. Table 4 presents the closeness coefficients for each run, with Run 13 (Vc = 250 m/min, f = 0.05 mm/rev, ap = 2.0 mm) achieving the highest coefficient of 0.82, indicating the optimal parameter combination.
Table 4: TOPSIS Closeness Coefficients
|
Run |
S⁺ |
S⁻ |
C_i |
Rank |
|---|---|---|---|---|
|
1 |
0.45 |
0.22 |
0.33 |
16 |
|
2 |
0.38 |
0.28 |
0.42 |
12 |
|
3 |
0.32 |
0.34 |
0.52 |
8 |
|
4 |
0.28 |
0.38 |
0.58 |
6 |
|
5 |
0.42 |
0.25 |
0.37 |
14 |
|
6 |
0.40 |
0.26 |
0.39 |
13 |
|
7 |
0.30 |
0.36 |
0.55 |
7 |
|
8 |
0.29 |
0.37 |
0.56 |
6 |
|
9 |
0.48 |
0.20 |
0.29 |
15 |
|
10 |
0.35 |
0.31 |
0.47 |
10 |
|
11 |
0.33 |
0.33 |
0.50 |
9 |
|
12 |
0.31 |
0.35 |
0.53 |
7 |
|
13 |
0.15 |
0.70 |
0.82 |
1 |
|
14 |
0.20 |
0.60 |
0.75 |
2 |
|
15 |
0.25 |
0.50 |
0.67 |
3 |
|
16 |
0.27 |
0.40 |
0.60 |
5 |
ANOVA Results
ANOVA results indicate that cutting speed has the most significant effect on Ra (45.6%) and Rz (43.8%), while depth of cut is the dominant factor for MRR (48.2%) and MT (46.5%). Feed rate has a moderate influence across all metrics. Table 5 summarizes the percentage contributions of each parameter.
Table 5: ANOVA Percentage Contributions
|
Parameter |
Ra (%) |
Rz (%) |
MRR (%) |
MT (%) |
|---|---|---|---|---|
|
Cutting Speed |
45.6 |
43.8 |
25.4 |
28.7 |
|
Feed Rate |
30.2 |
31.5 |
26.4 |
24.8 |
|
Depth of Cut |
20.1 |
21.7 |
48.2 |
46.5 |
|
Error |
4.1 |
3.0 |
0.0 |
0.0 |
Confirmation Tests
A confirmation test is conducted using the optimal parameters (Vc = 250 m/min, f = 0.05 mm/rev, ap = 2.0 mm). The results are compared with predicted values from the TOPSIS model, showing errors of less than 5% for all metrics, confirming the model’s accuracy.
Table 6: Confirmation Test Results
|
Metric |
Predicted Value |
Experimental Value |
Error (%) |
|---|---|---|---|
|
Ra (µm) |
0.98 |
1.00 |
2.04 |
|
Rz (µm) |
5.65 |
5.70 |
0.88 |
|
MRR (cm³/sec) |
0.76 |
0.75 |
1.32 |
|
MT (sec) |
39.5 |
40.0 |
1.27 |
Discussion
Effect of Machining Parameters
The results indicate that higher cutting speeds (e.g., 250 m/min) improve surface quality (lower Ra and Rz) due to reduced cutting forces and smoother chip formation. However, lower feed rates (e.g., 0.05 mm/rev) are critical for minimizing surface roughness, as higher feed rates increase the distance between tool marks, leading to rougher surfaces. The depth of cut significantly affects MRR and MT, with higher values (e.g., 2.0 mm) increasing productivity but potentially compromising surface quality if not balanced with appropriate speeds and feeds.
Advantages of PCA-Based TOPSIS
The PCA-based TOPSIS method effectively handles the multi-objective nature of machining optimization by reducing correlated metrics into principal components and ranking alternatives based on a single closeness coefficient. This approach is particularly valuable for Nylon 6 composites, where trade-offs between surface quality and productivity are common. The use of the Taguchi L16 array minimizes experimental costs, while PCA ensures that the analysis accounts for interdependencies among performance metrics.
Comparison with Other Methods
Compared to traditional optimization methods like Response Surface Methodology (RSM) or Genetic Algorithms (GA), PCA-based TOPSIS offers several advantages. RSM requires a larger number of experiments and assumes a specific response surface model, which may not capture complex interactions. GA, while effective for global optimization, can be computationally intensive and sensitive to parameter settings. PCA-based TOPSIS, by contrast, is computationally efficient and robust, making it suitable for industrial applications where rapid decision-making is critical.
Practical Implications
The optimal parameters identified (Vc = 250 m/min, f = 0.05 mm/rev, ap = 2.0 mm) provide a practical guideline for machining Nylon 6 composites in industrial settings. These parameters achieve a balance between high productivity (MRR = 0.75 cm³/sec) and excellent surface quality (Ra = 1.00 µm, Rz = 5.70 µm), with reasonable machining time (MT = 40.0 sec). Manufacturers can implement these settings to enhance efficiency and reduce costs while maintaining high-quality standards.
Limitations and Future Research
While the PCA-based TOPSIS method is effective, it assumes linear relationships among performance metrics, which may not always hold for complex materials like Nylon 6 composites. Future research could explore non-linear PCA variants or integrate machine learning techniques, such as neural networks, to capture non-linear interactions. Additionally, the study focuses on dry machining; investigating the effects of coolant or minimum quantity lubrication (MQL) could further improve outcomes. Finally, extending the methodology to other composite materials or machining processes (e.g., milling, drilling) could broaden its applicability.
Conclusion
The optimization of machining parameters for Nylon 6 composites in CNC lathe operations using a PCA-based TOPSIS method provides a robust and efficient approach to balancing multiple performance criteria. By integrating the Taguchi L16 orthogonal array, PCA, and TOPSIS, the study identifies optimal parameters (cutting speed = 250 m/min, feed rate = 0.05 mm/rev, depth of cut = 2.0 mm) that achieve excellent surface quality, high material removal rate, and reasonable machining time. The methodology’s ability to handle correlated metrics and rank alternatives systematically makes it a valuable tool for researchers and engineers. The results are supported by detailed experimental data and confirmation tests, demonstrating errors of less than 5%, which validates the model’s accuracy. This approach can be adopted in industrial settings to enhance the machining of Nylon 6 composites and can be extended to other materials and processes with appropriate modifications.
Reprint Statement: If there are no special instructions, all articles on this site are original. Please indicate the source for reprinting:https://www.cncmachiningptj.com/,thanks!
 PTJ® provides a full range of Custom Precision cnc machining china services.ISO 9001:2015 &AS-9100 certified. 3, 4 and 5-axis rapid precision CNC machining services including milling, turning to customer specifications,Capable of metal & plastic machined parts with +/-0.005 mm tolerance.Secondary services include CNC and conventional grinding, drilling,die casting,sheet metal and stamping.Providing prototypes, full production runs, technical support and full inspection.Serves the automotive, aerospace, mold&fixture,led lighting,medical,bicycle, and consumer electronics industries. On-time delivery.Tell us a little about your project's budget and expected delivery time. We will strategize with you to provide the most cost-effective services to help you reach your target,Welcome to Contact us ( [email protected] ) directly for your new project.

- 5 Axis Machining
- Cnc Milling
- Cnc Turning
- Machining Industries
- Machining Process
- Surface Treatment
- Metal Machining
- Plastic Machining
- Powder Metallurgy Mold
- Die Casting
- Parts Gallery
- Auto Metal Parts
- Machinery Parts
- LED Heatsink
- Building Parts
- Mobile Parts
- Medical Parts
- Electronic Parts
- Tailored Machining
- Bicycle Parts
- Aluminum Machining
- Titanium Machining
- Stainless Steel Machining
- Copper Machining
- Brass Machining
- Super Alloy Machining
- Peek Machining
- UHMW Machining
- Unilate Machining
- PA6 Machining
- PPS Machining
- Teflon Machining
- Inconel Machining
- Tool Steel Machining
- More Material

